Dent ED-COM-PAK-D Communications Package for Indoor Enclosures
$150.00
ELOG Software for the ELITEpro and DATApro Instruments
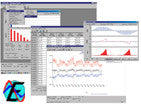
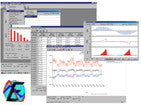
ELOG is the software package that is used for interfacing with the ELITEpro and DATApro instruments. Everything from Setup, Real-time Data Display, Data Analysis, Harmonic / Waveform Capture Analysis, and Automatic Data Collection is built into this Microsoft Windows - based software.
Set Up Mode


ELOG automatically detects what type of instrument it is communicating with and adjusts the appropriate options accordingly. This makes setting up your equipment even easier. All of the options are fully user configurable and can be turned ON or OFF with just one click. Examples of each page of the Setup Table follow, including asking for connection diagrams and what a Setup Table List looks like.
Communications capabilities can be explored with the Tool Bar including the LoggerList which is a listing of all loggers that are set up for Wired or Wireless communications.
Real-Time data display
After connecting the logger to a load, it is often useful to look at the parameters the logger is measuring to verify that the sensors have been installed and are operating correctly. Their are two types of Real-Time Data Display formats that you can choose; Text or Graph. Examples of both formats follow.


Data Analysis
Once the data stored in the Logger has been retrieved to a PC, there are three options available:
1) The data may be opened for viewing.
2) You can select a range of data.
3) From this data you can create many different types of graphs and even export the data as a comma separated variable file (.CSV) for viewing or further analysis in other applications such as spreadsheets.


A very useful way to get a quick summary of the data is to call up the Data File Summary. The Data File Summary opens Notepad and creates a new file that provides a snapshot of the data including; the measured parameters, the setup table and the logger itself.
Harmonic Analysis and Wave-Form Capture
The buttons along the lower left side of the window select the Channel to be displayed. One channel may be viewed at a time. This screen includes a good deal of information. The voltage and current harmonics are presented graphically in the upper part of the window. The y-axis is scaled in percent of the fundamental. The x-axis is the harmonic. Both even and odd harmonics are shown.
The actual value of the voltage and current for each harmonic may be found in the Harmonic Values box. By clicking on the arrow buttons, higher or lower order harmonics may be selected. The Waveform Values box provides summary statistics for the overall current and voltage waveforms. This includes the RMS value, Total Harmonic Distortion (THD), Peak values, and Crest Factor.
ELOG is the software package that is used for interfacing with the ELITEpro and DATApro instruments. Everything from Setup, Real-time Data Display, Data Analysis, Harmonic / Waveform Capture Analysis, and Automatic Data Collection is built into this Microsoft Windows - based software.
Set Up Mode


ELOG automatically detects what type of instrument it is communicating with and adjusts the appropriate options accordingly. This makes setting up your equipment even easier. All of the options are fully user configurable and can be turned ON or OFF with just one click. Examples of each page of the Setup Table follow, including asking for connection diagrams and what a Setup Table List looks like.
Communications capabilities can be explored with the Tool Bar including the LoggerList which is a listing of all loggers that are set up for Wired or Wireless communications.
Real-Time data display
After connecting the logger to a load, it is often useful to look at the parameters the logger is measuring to verify that the sensors have been installed and are operating correctly. Their are two types of Real-Time Data Display formats that you can choose; Text or Graph. Examples of both formats follow.


Data Analysis
Once the data stored in the Logger has been retrieved to a PC, there are three options available:
1) The data may be opened for viewing.
2) You can select a range of data.
3) From this data you can create many different types of graphs and even export the data as a comma separated variable file (.CSV) for viewing or further analysis in other applications such as spreadsheets.


A very useful way to get a quick summary of the data is to call up the Data File Summary. The Data File Summary opens Notepad and creates a new file that provides a snapshot of the data including; the measured parameters, the setup table and the logger itself.
Harmonic Analysis and Wave-Form Capture
The buttons along the lower left side of the window select the Channel to be displayed. One channel may be viewed at a time. This screen includes a good deal of information. The voltage and current harmonics are presented graphically in the upper part of the window. The y-axis is scaled in percent of the fundamental. The x-axis is the harmonic. Both even and odd harmonics are shown.
The actual value of the voltage and current for each harmonic may be found in the Harmonic Values box. By clicking on the arrow buttons, higher or lower order harmonics may be selected. The Waveform Values box provides summary statistics for the overall current and voltage waveforms. This includes the RMS value, Total Harmonic Distortion (THD), Peak values, and Crest Factor.
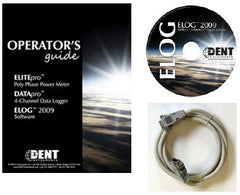
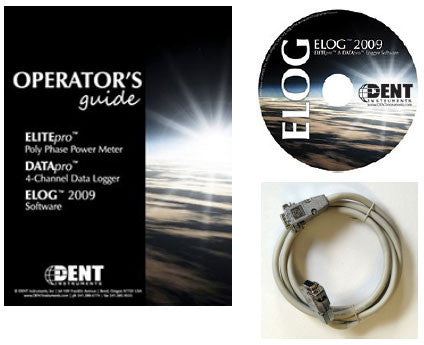
- ELOG Software for Setup and Reporting
- RS-232 Communications Cable
- ELITEpro or DATApro User Manual


Share this item: